
Travelers looking to gauge the on-time performance of nearby airports have several readily available options that they can turn to.
The U.S. Department of Transportation’s Bureau of Transportation Statistics keeps dozens of different data sets on nearly every aspect of air travel.
Prospective passengers can look up information on arrival delays, departure delays and delay causes, while also comparing cancellation rates from different airports. Frequently, data and other information are visualized in convenient graphs and charts, as well.
CU-CitizenAccess.org recently used the federal aviation statistics and found that about one out of every four flights departing from Champaign County’s Willard Airport is either delayed or canceled, for example. (About one of three flights coming in to Willard are delayed or cancelled so have some reading material if you’re going to meet family, friends or colleagues at the gate.)
In addition to the federal statistics, consumers can also browse flight tracking tools produced by private companies, such as FlightAware’s flight tracking service.
The handful of resources below can help consumers review their local airport and monitor flights.
Statistics on flight delays by airport
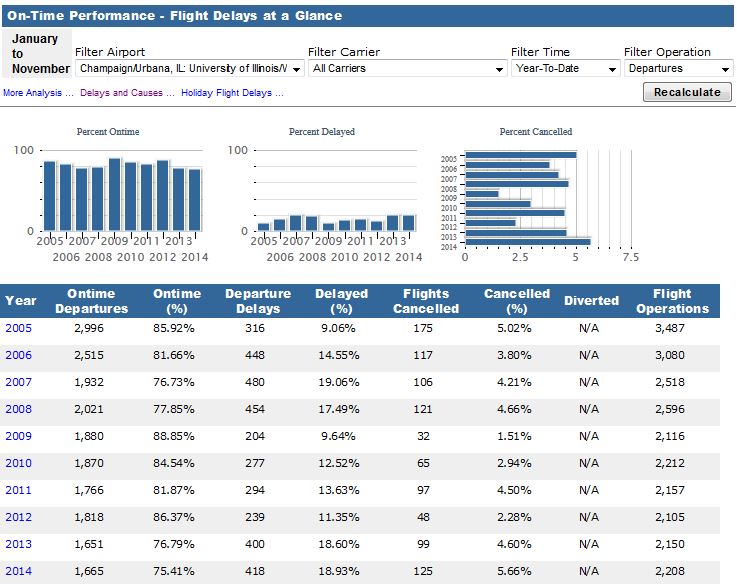
This main tool provides a snapshot of a given airport (The actual web address ishttp://home/citizenaccess/public_html.transtats.bts.gov/HomeDrillChart.asp).
Consumers can choose an airport, filter by specific airline and pick data for either arrivals or departures as in Figure 1.
Figure 1
One of the most important factors that goes into planes taking off on time is planes getting in on time.
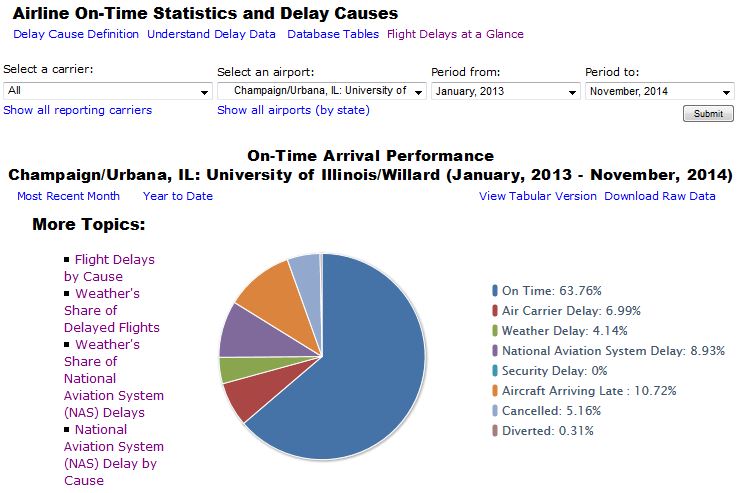
The Bureau of Transportation Statistic’s on-time arrival performance pie chart helps consumers see how many flights arrive at a given airport on time. Additionally, the tool allows consumers to see the top causes behind any arrival delays. Nationally, flights land on-time about 80 percent of the time. (The web address ishttp://home/citizenaccess/public_html.transtats.bts.gov/OT_Delay/OT_DelayCause1.asp)
Travelers can narrow their searches by carrier, by airport and by time period.
For instance, a review of flights arriving at Willard Airport from Jan. 2013 through November 2014 shows that 63 percent of flights landed on time. During that period, two main reasons for flights landing late were National Aviation System delays and air carrier delays, according to the data. See Figure 2.
Figure 2
Airport rankings by on-time performance
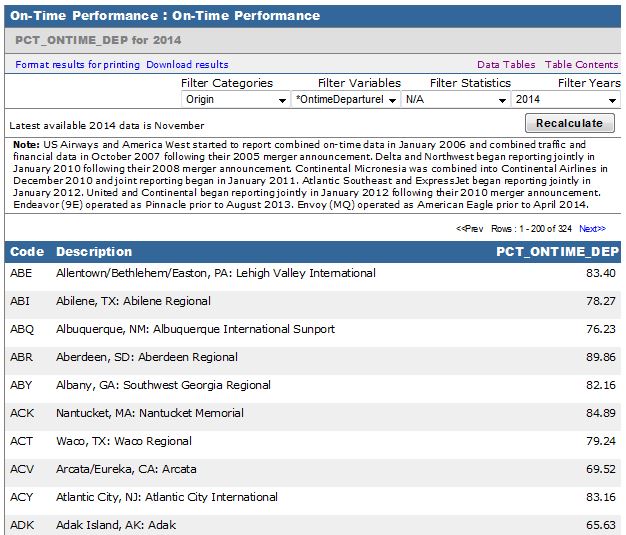
Consumers can use this link to see how their airport compares to other national airports at this web address –http://home/citizenaccess/public_html.transtats.bts.gov/Oneway.asp.
After clicking on the link, filter the search by selecting the desired categories and variables. To rank airports based on on-time departure, choose “origin” for “Filter Categories” and choose “OntimeDeparturePct” for “Filter Variables.” Enter the desired “Filter Years,” then click “Recalculate.” as shown in Figure 3.
The tool will then rank all national airports based on on-time departure for a given year.
Figure 3
Flight Tracker at http://flightaware.com/ is a free online tool that consumers can use to look up detailed, real-time information on flights. For example, by using Flight Tracker to review Willard Airport flights to Chicago on Jan. 27, 2015, consumers can see the airport has six flights, one of which is canceled.
By using Flight Tracker, shown in Figure 4, consumers can also see if their specific flight is on schedule.
Figure 4

On-time performance by time period
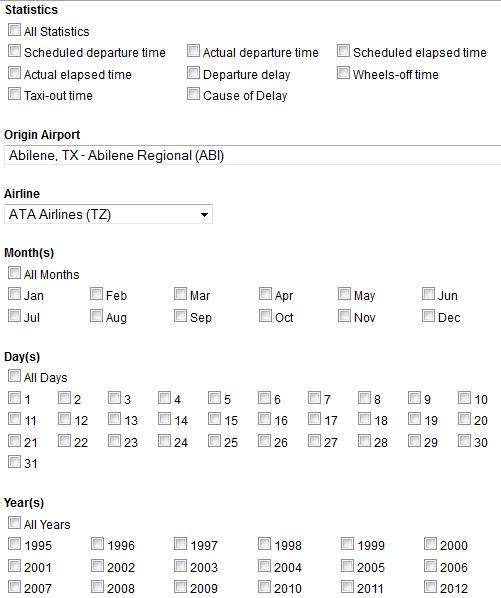
Consumers can use this tool athttp://apps.bts.gov/xml/ontimesummarystatistics/src/dstat/OntimeSummaryDepatures.xml to review flight history for any airport during a range of time as shown in Figure 5.
Figure 5
If you have a favorite web site or tool to keep up on air travel, please send it to hello@cu-citizenaccess.org.